coredump_fault#
Overview#
The coredump_fault example demonstrates the basic usage of debug/coredump component.
In this example, a Usagefault is intentionally triggered using a division-by-zero operation. The fault is then captured in the UsageFault_Handler, where the cause of the fault, the current Exception Stack Frame (ESF), and partial RAM contents are saved to flash memory using the coredump component.
Afterward, a software reset is triggered. Upon reboot, the fault’s cause is analyzed using the API provided by the coredump component.
Please note that only flash targets are supported!
Running the demo#
Note: Once the program is download to the target board, please press Reset Button to reset program.
Expected log:
    Coredump Fault Example Start!
    Press any key to trigger usagefault...
    Coredump Fault Example Rebooted!!!
    Press any key to check coredump reason...
    [Info] Size: 3894.
    [Info] Reason: Usagefault caused by an integer divsion by zero!
How to debug#
Download the program and press SW1 to reset the program. Following log will be observed in terminal:
Coredump Fault Example Start! Press any key to trigger usagefault…Attach to running target with debugger.
Press any key in terminal.
Use GDB server to examine core dump data.#
This feature is verified on armgcc toolchain.
Save the data with an offset of 0x10 from the coredump flash partition(Define in
CONFIG_MFLASH_COREDUMP_REGION_START_ADDR) into a binary file (e.g., log.bin).Note: The offset should be 0x10. Otherwise [ERROR][parser] Log header ID not found… will reported.
Note: Recommend to use Ozone.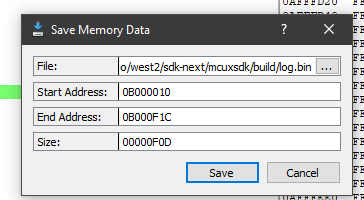
Start the custom GDB server using the script coredump_gdbserver.py with the core dump binary log file(saved in step 1) and example elf file as pararmeters:
python ../components/debug/coredump/scripts/coredump_gdbserver.py coredump_fault.elf log.bin --port=2331Start GDB:
arm-none-eabi-gdb.exe .\coredump_fault.elfInside GDB, connect to the GDB server via port 2331:
(gdb) target remote localhost:2331
Output from GDB Client:Remote debugging using localhost:2331 0x080051d8 in DEMO_TriggetUseFault () at C:/Arepo/west2/sdk-next/mcuxsdk/examples/component_examples/coredump_fault/coredump_fault.c:152 152 x = x / y;
Examine the Core registers:
(gdb) info registersOutput from GDB Client:r0 0x61 97 r1 0x200033b8 536884152 r2 0x0 0 r3 0x1 1 r4 0x0 0 r5 0x0 0 r6 0x0 0 r7 0x0 0 r8 0x0 0 r9 0x0 0 r10 0x0 0 r11 0x0 0 r12 0x12121212 303174162 sp 0x20003398 0x20003398 <ucHeap+2136> lr 0x80051f3 134238707 pc 0x80051d8 0x80051d8 <DEMO_TriggetUseFault+40> xpsr 0x61000000 1627389952
Examine the backtrace:
(gdb) btOutput from GDB Client:#0 0x080051d8 in DEMO_TriggetUseFault () at C:/Arepo/west2/sdk-next/mcuxsdk/examples/component_examples/coredump_fault/coredump_fault.c:152 #1 0x080051f2 in DEMO_FaultTriggerTask (parameters=<optimized out>) at C:/Arepo/west2/sdk-next/mcuxsdk/examples/component_examples/coredump_fault/coredump_fault.c:73 #2 0x00000000 in ?? () Backtrace stopped: previous frame identical to this frame (corrupt stack?)
Query thread info:
(gdb) info threadsOutput from GDB Client:Id Target Id Frame * 1 Thread 1 (name: ) 0x080051d8 in DEMO_TriggetUseFault () at C:/Arepo/west2/sdk-next/mcuxsdk/examples/component_examples/coredump_fault/coredump_fault.c:152 2 Thread 2 (name: DEMO_MainTask, state: 0x80, user_options: 0x0, prio: 0x3) <unavailable> in ?? () 3 Thread 3 (name: DEMO_FaultTriggerTa, state: 0x0, user_options: 0x0, prio: 0x3) <unavailable> in ?? () 4 Thread 4 (name: IDLE, state: 0x80, user_options: 0x0, prio: 0x0) <unavailable> in ?? () 5 Thread 5 (name: Tmr Svc, state: 0x2, user_options: 0x0, prio: 0x4) <unavailable> in ?? ()
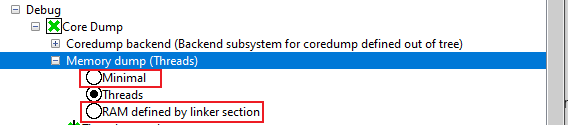
Update default settings#
This example defaults to dumping thread structure and stacks of all threads, and user can switch to other memory type
by change “Memory dump” option in Kconfig.