Useful Tools#
Optimization Tools#
The MCUXpresso SDK build system exposes a set of build targets to analyze the RAM and ROM footprint of an application image and to inspect the resulting data structures. An HTML dashboard can also be generated for a more dynamic view of build artifacts and metrics.
All targets in this section are defined in
cmake/extension/reports/CMakeLists.txt and are invoked through
west build -t <target> against an existing build directory.
Footprint and Memory Usage#
The build system offers several targets to view and analyze RAM and ROM usage in generated images. The tools run on the final image and give information about size of symbols and code being used in both RAM and ROM.
Some of the tools mentioned in this section are organizing their output based on the physical organization of the symbols. As some symbols might be external to the project’s tree structure, or might lack metadata needed to display them by name, the following top-level containers are used to group such symbols:
(hidden) - The RAM and ROM reports list all processing symbols with no matching mapped files in the Hidden category.
This means that the file for the listed symbol was not added to the metadata file, was empty, or was undefined. The tool was unable to get the name of the function for the given symbol nor identify where it comes from.
(no paths) - The RAM and ROM reports list all processing symbols with relative paths in the No paths category.
This means that the listed symbols cannot be placed in the tree structure of the report at an absolute path under one specific file. The tool was able to get the name of the function, but it was unable to identify where it comes from.
Note
You can have multiple cases of the same function, and the No paths category will list the sum of these in one entry.
Build Target: ram_report#
List all compiled objects and their RAM usage in a tabular form with bytes per symbol and the percentage it uses. The data is grouped based on the file system location of the object in the tree and the file containing the symbol.
Use the ram_report target with your build directory:
west build -b <board> <application>
west build -t ram_report
This will generate something similar to the output below:
Path                                                                     Size       %  Address    Section
==========================================================================================================
Root                                                                     3264 100.00%  -
├── (hidden)                                                             3107  95.19%  -
├── (no paths)                                                             28   0.86%  -
│   ├── SystemCoreClock                                                     4   0.12%  0x20000000 .data
│   ├── s_lpuartHandle                                                     12   0.37%  0x20000084 .bss
│   └── s_lpuartIsr                                                        12   0.37%  0x20000090 .bss
└── SDK_BASE                                                               33   1.01%  -
    ├── components                                                         20   0.61%  -
    │   └── debug_console_lite                                             20   0.61%  -
    │       └── fsl_debug_console.c                                        20   0.61%  -
    │           └── s_debugConsole                                         20   0.61%  0x200000a4 .bss
    ├── drivers                                                             8   0.25%  -
    │   └── ostimer                                                         8   0.25%  -
    │       └── fsl_ostimer.c                                               8   0.25%  -
    │           ├── s_ostimerHandle                                         4   0.12%  0x2000009c .bss
    │           └── s_ostimerIsr                                            4   0.12%  0x200000a0 .bss
    └── examples                                                            1   0.03%  -
==========================================================================================================
                                                                         3264
Build Target: rom_report#
List all compiled objects and their ROM usage in a tabular form with bytes per symbol and the percentage it uses. The data is grouped based on the file system location of the object in the tree and the file containing the symbol.
west build -t rom_report
The output format mirrors ram_report but covers code and read-only
data sections.
Build Target: footprint#
Convenience target that runs both ram_report and rom_report
back-to-back and writes ram.json / rom.json into the build
directory.
west build -t footprint
Use this when you need machine-readable JSON output (for example to
diff footprint between two builds with scripts/footprint/fpdiff.py).
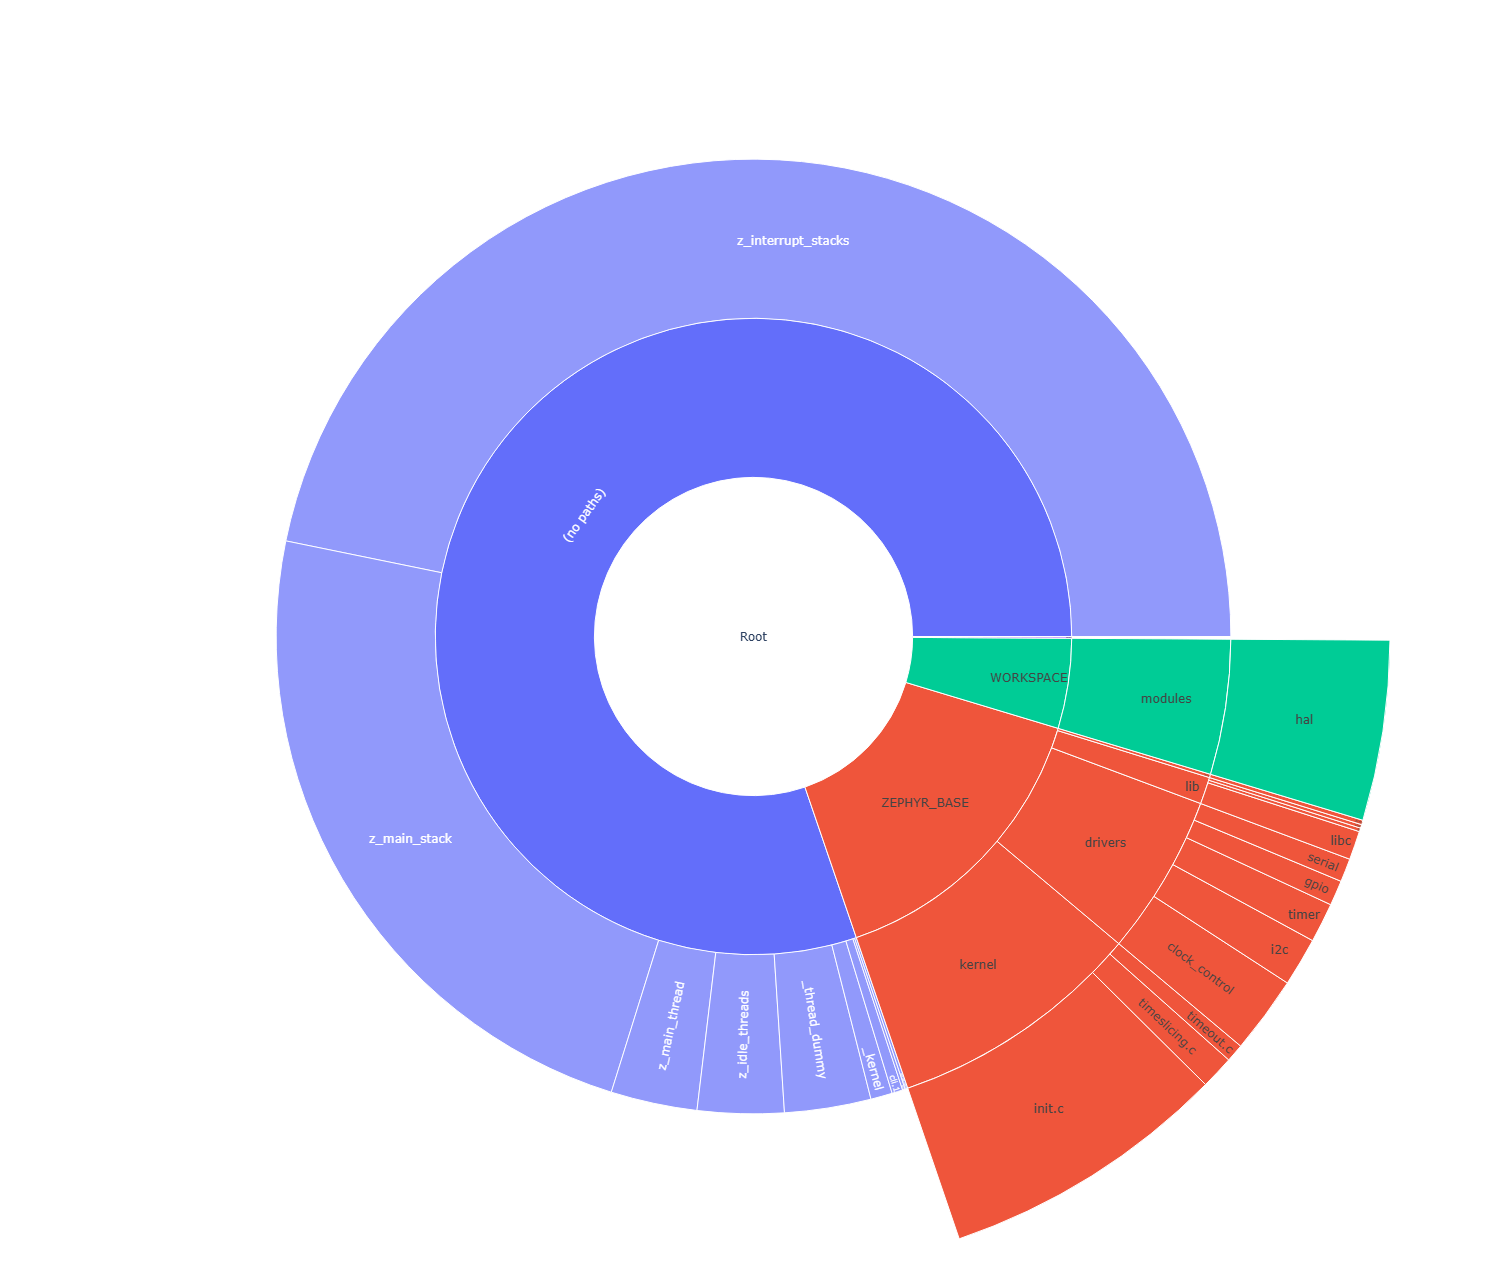
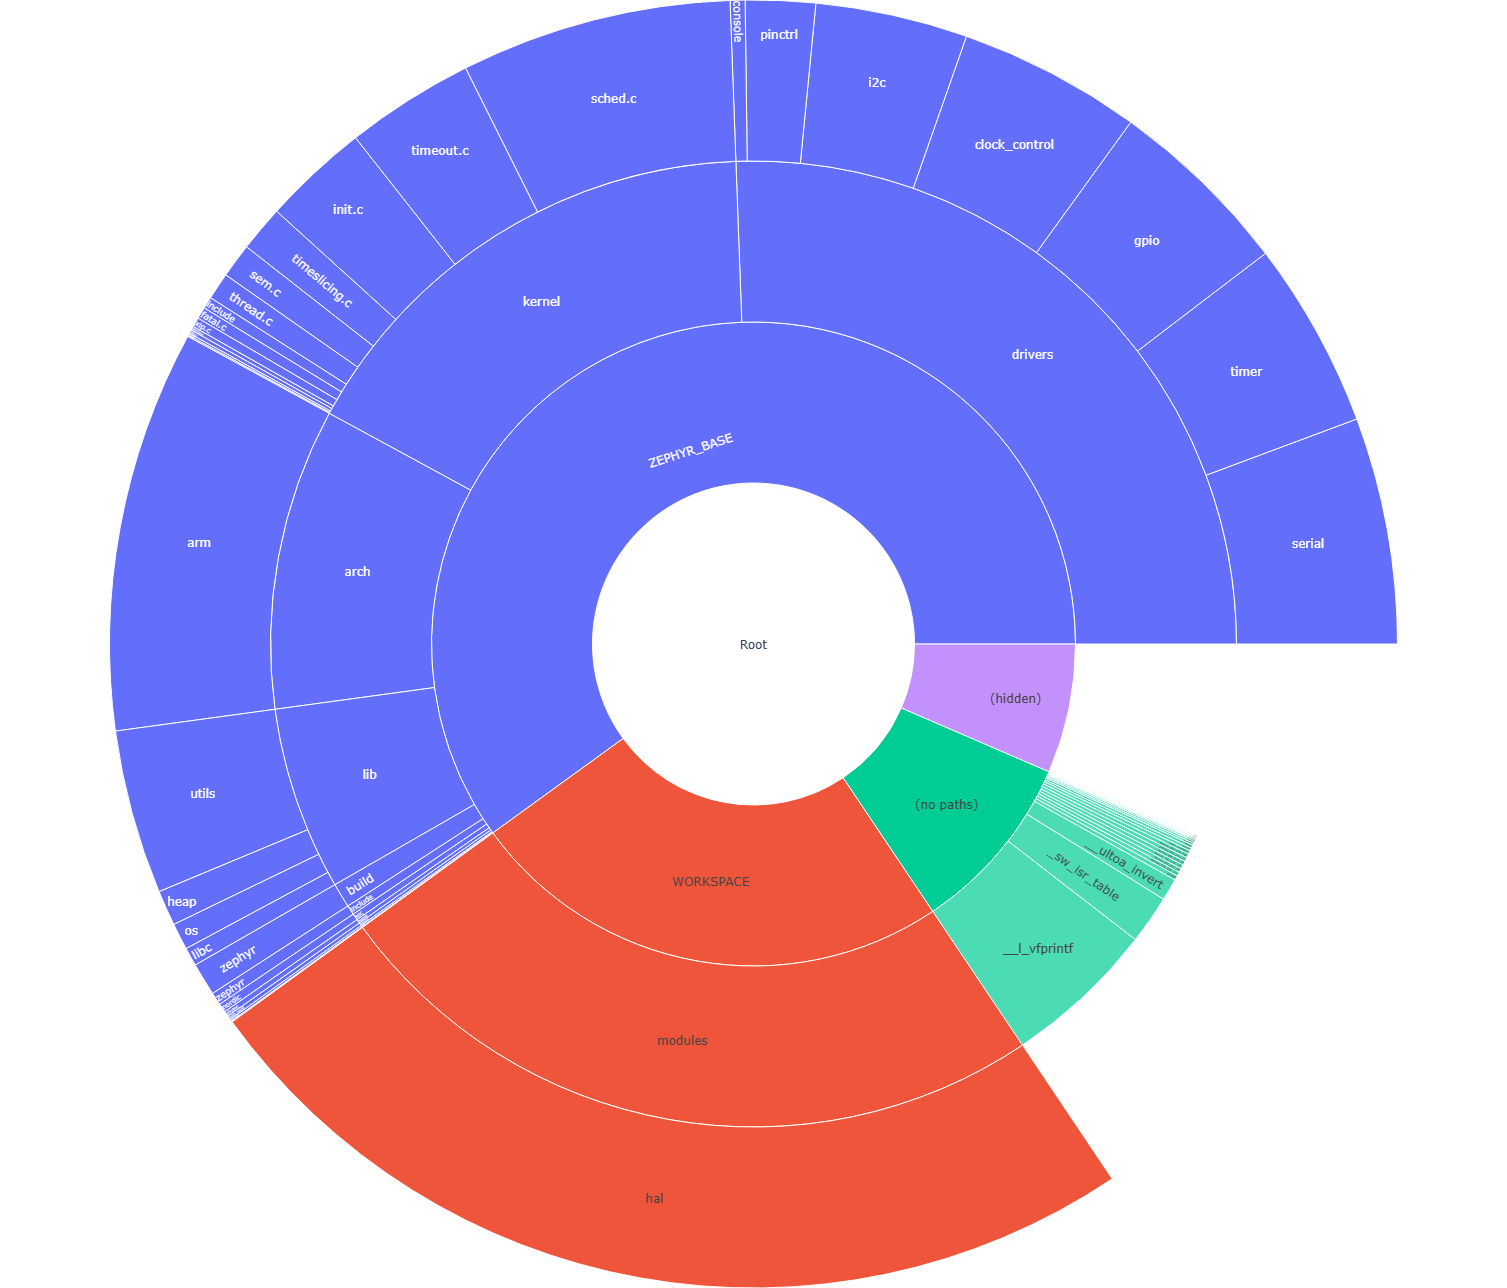
Build Targets: ram_plot / rom_plot#
Similar to the ram_report and rom_report build targets, these
targets generate memory usage reports in a sunburst chart as a visual
representation. A user can click on segments to navigate through the
directory structures, and hover over segments to get more details.
Running the targets will first generate the CLI report and then open a browser window.
west build -t ram_plot
And similarly for the ROM usage:
west build -t rom_plot
Plot generation requires the plotly Python package:
pip install plotly
Build Target: puncover#
This target uses a third-party tool called puncover which can be found at HBehrens/puncover. When this target is built, it will launch a local web server which will allow you to open a web client and browse the files and view their ROM, RAM, and stack usage.
Before you can use this target, install the puncover Python module:
pip3 install --user puncover
Warning
This is a third-party tool that might or might not be working at any given time. Please check the GitHub issues, and report new problems to the project maintainer.
After you installed the Python module, use the puncover target with
your build directory:
west build -t puncover
The puncover target will start a local web server on
localhost:5000 by default. The host IP and port the HTTP server
runs on can be changed by setting the environment variables
PUNCOVER_HOST and PUNCOVER_PORT.
Data Structures#
Build Target: pahole#
Poke-a-hole (pahole) is an object-file analysis tool to find the size of the data structures, and the holes caused due to aligning the data elements to the word-size of the CPU by the compiler.
Poke-a-hole (pahole) must be installed prior to using this target. It
can be obtained from
https://git.kernel.org/pub/scm/devel/pahole/pahole.git and is available
in the dwarves package on both Fedora and Ubuntu:
sudo apt-get install dwarves
Alternatively, you can get it from Fedora:
sudo dnf install dwarves
After you installed the package, use the pahole target with your
build directory:
west build -t pahole
Pahole will generate something similar to the output below in the console:
/* Used at: [...]/build/kobject_hash.c */
/* <397> [...]/include/sys/dlist.h:36 */
struct _dnode {
        union {
                struct _dnode *    head;                 /*     0     4 */
                struct _dnode *    next;                 /*     0     4 */
        };                                               /*     0     4 */
        union {
                struct _dnode *    tail;                 /*     4     4 */
                struct _dnode *    prev;                 /*     4     4 */
        };                                               /*     4     4 */

        /* size: 8, cachelines: 1, members: 2 */
        /* last cacheline: 8 bytes */
};
Dashboard#
An HTML dashboard can be generated that consolidates the various tool outputs and artifacts into one simple view. In addition to a basic summary of the build results, the following details are included:
Full memory reports (RAM, ROM, and a combined view) in drill-down tree form as well as sunburst plots (as per the
footprint,ram_plot, androm_plotbuild targets).Kconfig symbol values and sources, with an interactive search (driven by the
.config-trace.pickleproduced during configure).ELF section header listing for the application image.
Use the dashboard target with your build directory:
west build -t dashboard
This will generate the following output file and open it in the default browser:
build/dashboard/index.html
The dashboard is fully self-contained: every CSS, JavaScript, and font
asset is copied into build/dashboard/static/ so the report can be
archived or shared without requiring network access.
See scripts/dashboard/README.md for the list of Python dependencies
and more details on the supported pages and customization.