Run and Debug DSP Demo using Xplorer IDE
This section lists the steps to:
Prepare Arm Core for ‘Hello World’
Each of the DSP demos included in the MCUXpresso SDK consists of two separate applications that run on the Arm core and DSP core. The Arm core application initializes the DSP core and executes other application-specific functionality.
To debug the ‘Hello World’ DSP application, you must first set up and execute the Arm application using an environment of your choice. It is required to modify the global preprocessor macro, DSP_IMAGE_COPY_TO_RAM, to control loading of the DSP binary application.
When this macro is set to ‘0’/FALSE, the Arm application and DSP application are independently loaded and debugged.
Build and execute the ‘Hello World’ Arm demo located in:
<SDK_ROOT>/boards/mimxrt700evk/dsp_examples/hello_world_usart/cm33/.
Preparing an Arm core development environment is outside the scope of this document.
Note: If you are using MCUXpresso, it is highly recommended to upgrade to latest version of the SDK and match the latest EVK board.
Parent topic:Run and Debug DSP Demo using Xplorer IDE
Start Xtensa Debugger Daemon
To debug DSP applications on RT700, ensure that the xt-ocd daemon is running. This application runs a gdb server that the Xtensa core debugger connects to.
Go to the command-line window and change directory (cd) to xt-ocd daemon installation path. The default path on Windows is C:\Program Files (x86)\Tensilica\Xtensa OCD Daemon 14.11.
Execute the daemon with the custom topology.
**xt-ocd.exe -c topology.xml**
XOCD 14.11 2023-04-06 14:27:20
(c) 1999-2024 Cadence Design Systems Inc. All rights reserved.
[Debug Log 2024-02-19 22:41:53]
Loading module "gdbstub" v2.0.0.12
Loading module "jlink" v2.0.2.0
Using JLINK lib v.79410
Jlink USB Serial Number: 851006054
Connected to Jlink Device:
  Name:'SEGGER J-Link'
  S/N:851006054
  Firmware: J-Link V11 compiled Dec  4 2023 10:22:45
  Requested/Set TCK: 1000kHz/1000kHz
Jlink: Select pipelined SWD
SWD-DP with ID 0x6BA02477
Loading module "jtag" v2.0.0.20
Loading module "xtensa" v2.0.0.48
Starting thread 'GDBStub'
Opened GDB socket at port 20000
Initialize XDM driver
Warning: Warning: DAP Reset request failed! Ignoring...
Note: Some warning messages are expected and can be ignored. If you receive an error initializing the XDM driver, initialize and start the DSP core before debugging. For details on initializing and debugging, see Initialize DSP Core and Link DSP Profiles.
Parent topic:Run and Debug DSP Demo using Xplorer IDE
Prepare DSP Core for ‘Hello World’
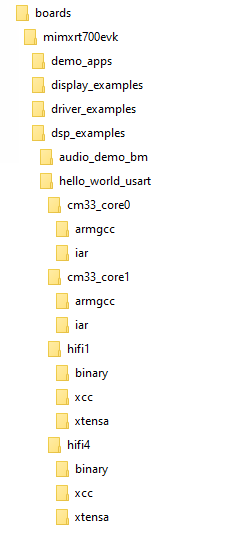
The RT700 SDK provides a collection of DSP example applications located in boards/mimxrt700evk/dsp_examples/. Each DSP example has two four source directories for cm33_core0, cm33_core1, hifi1, and hifi4 cores. In this guide, HiFi4 example will be explained, but HiFi1 examples can be run with the same steps.
|
|
The projects for different supported toolchains are built in the above directories. For the DSP example above, the ‘xcc’ project builds on the command line and the ‘xtensa’ directory is an Xplorer IDE project.
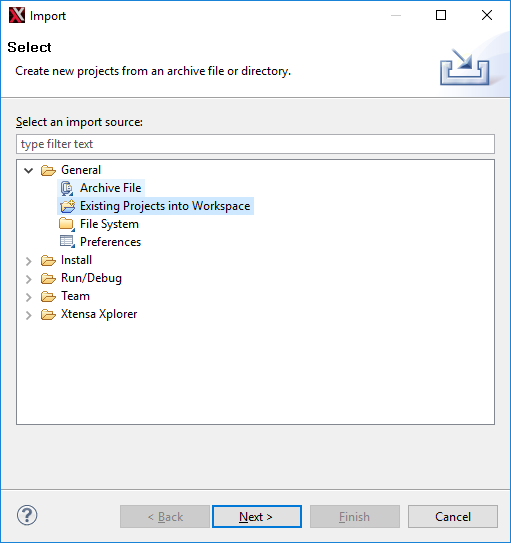
To run the ‘Hello World’ demo, import the SDK sources into the Xplorer IDE.
Select File > Import > General > Existing Projects into Workspace.
|
|
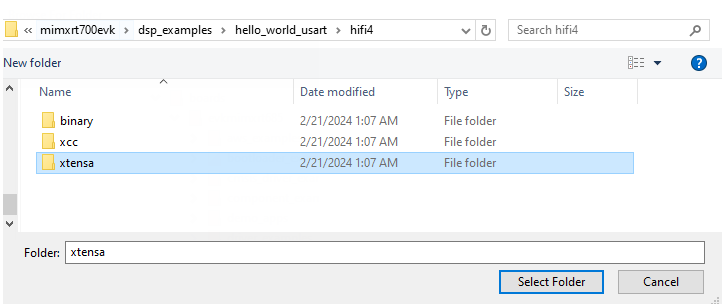
Select the SDK directory
<SDK_ROOT>\boards\mimxrt700evk\dsp_examples\hello_world_usart\hifi4\xtensaas root directory.|
|
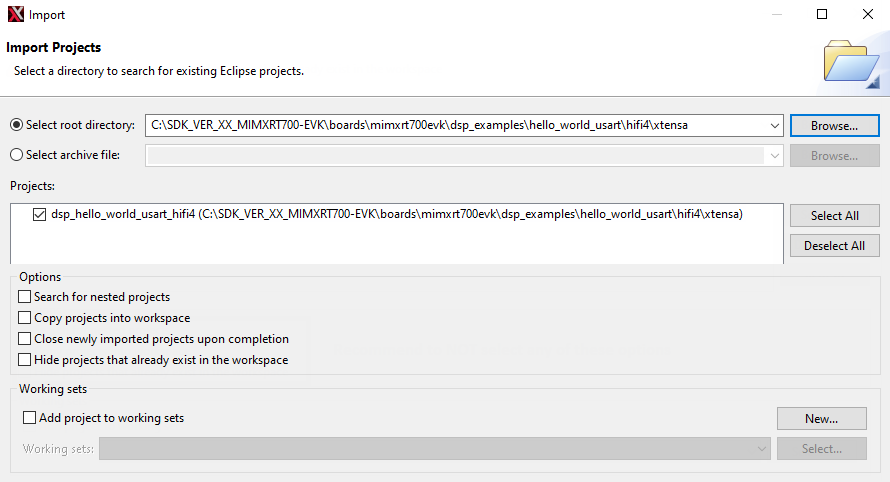
Leave all the other check boxes blank.
|
|
Once imported, the ‘dsp\_hello\_world\_usart\_hifi4’ appears in the Project Explorer.
To make a build selection for the project and hardware target configuration, use the drop-down buttons on the menu bar.
|
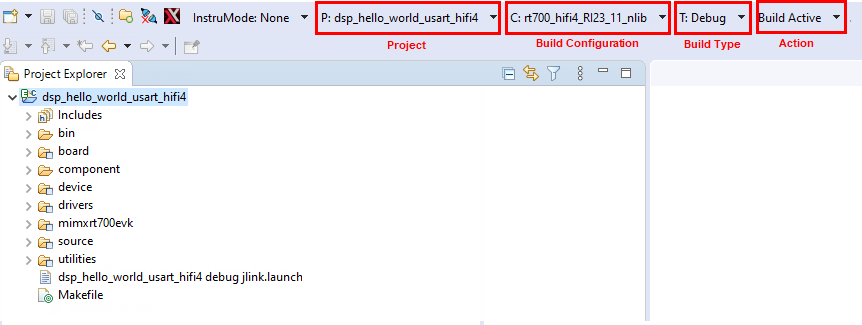
|
To build the project for debug, profile, or trace, use the action buttons on the right side of the menu bar.
|
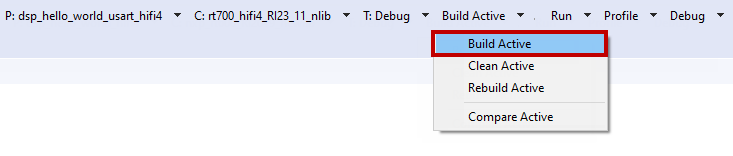
|
A default debug configuration is provided by the SDK project, which utilizes the on-chip debugger.
To choose the configuration, select the Debug Configurations menu item.
|
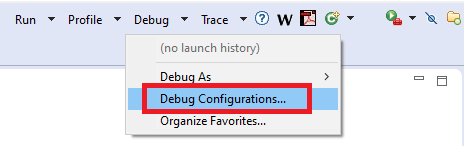
|
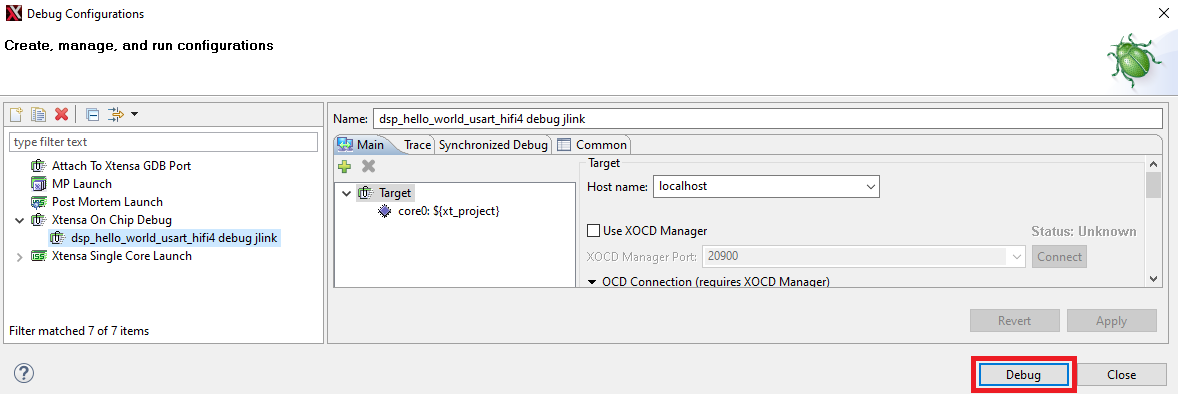
The **Debug Configurations** dialog box appears.
Expand the Xtensa On Chip Debug tree option and select ‘dsp_hello_world_hifi4_debug_jlink’.
|
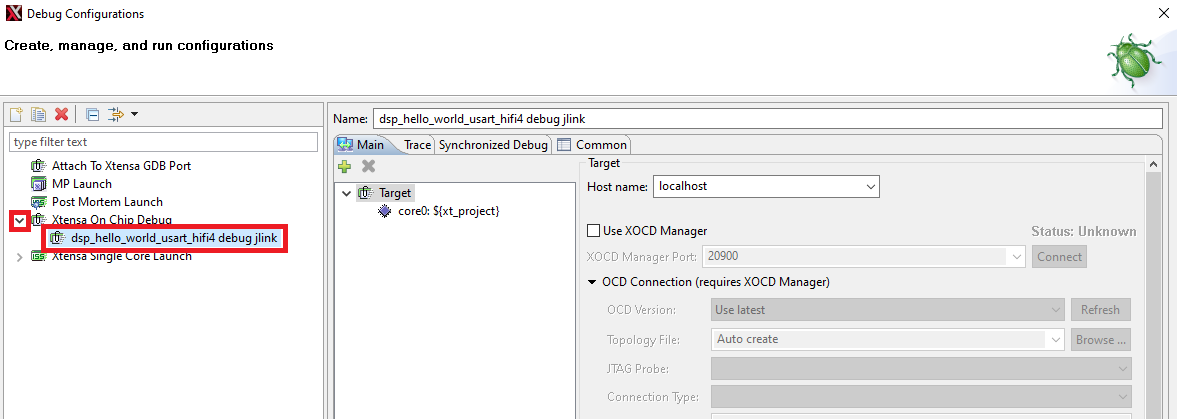
|
Click the Debug button. The actual debug on the chip initiates.
|
|
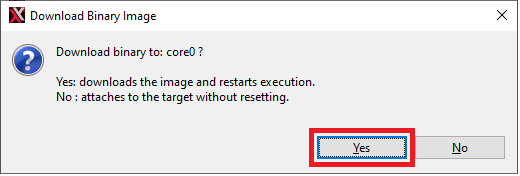
The Xplorer IDE prompts whether binaries should download to the hardware.
Select Yes.
|
|
The Xplorer IDE transitions to the Debug perspective after the binary download.
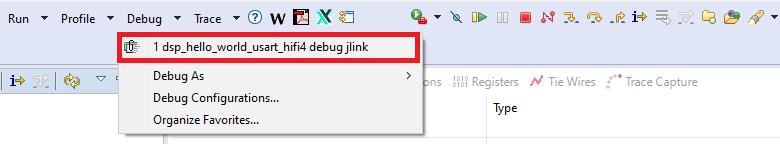
Note: After initial configuration, it is possible to select the same debug configuration as in Figure 8.
|
|
The **Debug** perspective appears as in [Figure 9](prepare_dsp_core_for_hello_world.md#GVDVWQC).
|
|
The program stops at the start of main\(\) function. To run the program, click the **Resume** or **Stepping through** icon button as shown in [Figure 10](prepare_dsp_core_for_hello_world.md#LKWEUGG).
|
|
After resuming / stepping through the ‘printf’ statement, the following output appears in the Console view of the IDE.
Hello World running on DSP core 'rt700_hifi4_RI23_11_nlib'
To return to the default IDE layout after the debugging completes, select the previous code perspective.
|

|
Parent topic:Run and Debug DSP Demo using Xplorer IDE